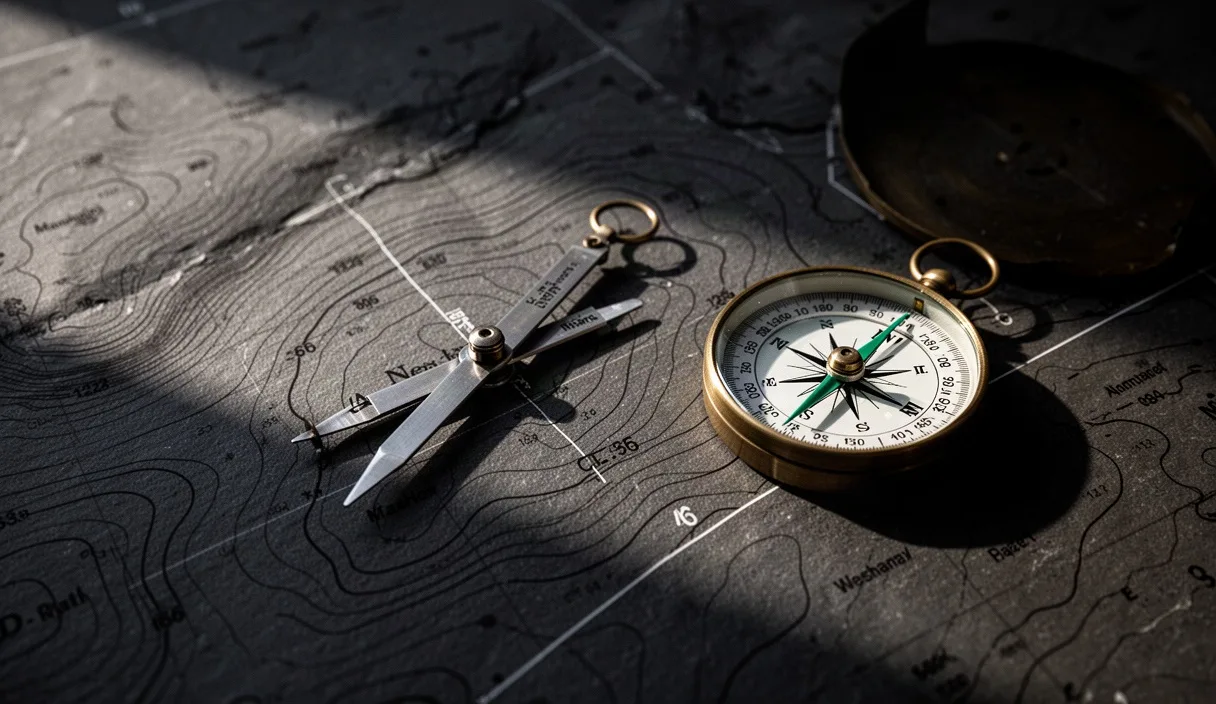

Topographic maps translate a three-dimensional landscape into a two-dimensional paper or digital display. For walkers, the most valuable feature on these maps is the contour line, which connects continuous points of equal elevation above sea level. By learning to measure the spacing between these lines and calculate the vertical rise over horizontal distance, you can accurately forecast how long a specific journey will take rather than relying on flat-distance estimates that frequently fail in undulating terrain.
Estimating walking times requires combining geometry, human biomechanics, and environmental conditions. While flat pavement permits a steady, predictable stride, trail surfaces interspersed with ascents and descents disrupt forward cadence. Nordic walking poles change this equation by redistributing physical effort and altering stability on gradients. This guide outlines how to read elevation markings, adjust mathematical travel rates for pole users, recognize subtle terrain hazards, and calculate defensible margins of safety.
Fundamentals of Topographic Maps and Contour Spacing
A contour line represents an imaginary horizontal slice through the terrain at an established vertical interval. On standard Ordnance Survey 1:25,000 Explorer maps, this interval is typically 5 metres in low-lying or moderately rolling regions, though it expands to 10 metres in rugged upland zones. On 1:50,000 Landranger maps, the vertical interval is consistently 10 metres. Always inspect the map legend before plotting a route, because mistaking a 10-metre interval for a 5-metre interval halves your calculated vertical gain and causes significant time errors.
Every fifth contour line appears as a thicker, bolder trace known as an index contour. These lines frequently include numerical elevation labels oriented so that the top of the number points uphill. If an index contour reads 45 and the next adjacent index contour reads 70 with four thinner lines between them, the vertical interval is confirmed at 5 metres. The closer the contour lines lie to one another horizontally, the steeper the incline. When lines pinch together so closely that they appear to merge, they denote a vertical bluff or crag.
Gradient can be expressed as a ratio of vertical rise to horizontal run, or as a percentage. To determine gradient along a planned route:
- Measure the horizontal distance between two points along the track using a map compass ruler or a calibrated piece of string, then apply the map scale (for example, 4 centimetres on a 1:25,000 map equals 1,000 horizontal metres).
- Count the contour lines crossed between those two points and multiply by the vertical interval to derive total elevation gain.
- Divide the horizontal distance by the vertical gain to produce the slope ratio. For example, gaining 50 metres over a horizontal distance of 500 metres produces a 1:10 slope, which equals a 10 percent gradient.
Slopes under 5 percent generally permit normal walking speed. Slopes between 6 percent and 15 percent impose a measurable reduction in forward velocity, while slopes exceeding 16 percent demand specialized pacing techniques, shorter strides, and dedicated energy management.
Naismith's Formula Modified for Nordic Walkers
In 1892, Scottish mountaineer William Naismith formulated a simple rule of thumb for cross-country foot travel: allow 1 hour for every 5 kilometres (3.1 miles) of horizontal distance, plus an additional 30 minutes for every 300 metres of ascent. This baseline assumes an unencumbered, reasonably fit adult moving across open, dry ground. It equates to an ascent penalty of 1 minute per 10 vertical metres, or 6 seconds per vertical metre.
Nordic walking alters horizontal and vertical mechanics. When pole technique is applied correctly, the user engages the latissimus dorsi, triceps, and abdominal muscles to share the propulsion work typically borne solely by the lower limbs. On level ground, Nordic walkers often maintain a higher average cruising speed than ordinary ramblers, commonly achieving 5.5 to 6.0 kilometres per hour due to longer stride extension. On ascents, pole planting reduces peak knee and ankle torque, allowing a steadier pace, though cardiovascular oxygen consumption increases.
Descents introduce a different variable. Naismith did not add time for downhills, but steep descents slow walkers down due to eccentric muscle contraction and joint impact. Eric Langmuir later refined Naismith's rule for descents, suggesting that walkers subtract 10 minutes per 300 metres lost on gentle declines between 5 degrees and 12 degrees, but add 10 minutes per 300 metres lost on steep declines exceeding 12 degrees. For Nordic walkers, poles act as brakes on declines, stabilizing balance but physically limiting forward speed.
| Terrain Phase | Standard Naismith Baseline | Langmuir Upland Adjustment | Modified Nordic Walking Rate |
|---|---|---|---|
| Flat terrain (firm surface) | 5.0 km/h (12.0 min/km) | 5.0 km/h (12.0 min/km) | 5.6 km/h (10.7 min/km) |
| Moderate ascent (under 12%) | Add 1 min per 10m gain | Add 1 min per 10m gain | Add 0.8 min per 10m gain |
| Steep ascent (over 12%) | Add 1 min per 10m gain | Add 1.5 min per 10m gain | Add 1.2 min per 10m gain |
| Gentle descent (5% to 12%) | No adjustment (0 min) | Subtract 0.33 min per 10m drop | Maintain flat pace (0 min) |
| Steep descent (over 12%) | No adjustment (0 min) | Add 0.33 min per 10m drop | Add 0.5 min per 10m drop |
To calculate a route segment using the modified Nordic figures, execute the calculation in three distinct parts: horizontal transit time, vertical climb penalty, and steep descent penalty. Sum the three values to produce the base segment estimate.
Identifying Steep Micro-Terrain and Drainage Obstacles
Standard contour intervals smooth out terrain features that fall below the map threshold. A 4-metre ditch, a collapsed river embankment, or a rocky step does not register on a map using a 5-metre contour interval. Walkers must deduce the presence of these micro-terrain features by analyzing how surrounding contour lines bend and how watercourses intersect the path.
Contour lines form recognizable patterns that identify specific landforms. A series of concentric closed loops indicates a hill or knoll if elevations rise toward the center, or a depression if values decrease. Where contour lines form distinct "V" or "U" shapes pointing toward higher elevation, they denote a valley, re-entrant, or drainage gully. Conversely, when the apex of the "V" points downhill, it denotes a spur or ridge. Crossing a valley requires descending into a depression and climbing out the other side, a physical movement often accompanied by loose gravel, mud, or scrub vegetation.
Drainage obstacles substantially degrade walking speeds. Look closely at points where paths cross blue hydrological lines:
- V-shaped contours around streams: When a path intersects closely spaced V-shaped contours directly adjacent to a blue stream line, expect a steep, eroded embankment. Negotiating these descents and ascents with poles requires careful placement to prevent tips slipping on wet clay.
- Widely spaced contours with marsh symbols: Flat expanses where contours are far apart and accompanied by reed or marsh symbols indicate waterlogged soils, peat, or standing surface water. Walking speeds across saturated marshland can drop below 2.5 kilometres per hour regardless of pole use.
- Parallel lines close to tracks: When two or three contour lines crowd directly against a path that runs along a hillside, the trail itself may be cut into an unstable camber, requiring slower foot placement to prevent lateral ankle roll.
If an inland route requires traversing three deeply incised re-entrants within a single kilometre, add at least 8 to 12 minutes to the leg time beyond what horizontal distance and gross elevation change suggest.
Planning Energy Budget According to Elevation Profiles
Calculating the total time for a walk does not account for the sequence in which climbs and descents occur. Energy expenditure is not linear. Traversing 300 metres of elevation gain early in a route taxes physiological reserves differently than encountering that same climb after four hours of continuous travel. Drawing or inspecting an elevation profile helps distribute effort predictably across the day.
To manage metabolic output, divide your route into distinct legs bounded by logical landscape transitions such as ridges, path junctions, or stream crossings. Calculate the average gradient for each leg independently. Legs with an average gradient under 4 percent serve as recovery sections where you can settle into an efficient, rhythmic arm swing and restore normal respiratory depth. Legs featuring sustained gradients above 8 percent require a planned reduction in stride length.
When planning legs with significant elevation, apply these operational principles:
- Cap initial output: On climbs occurring during the first third of the route, deliberately reduce forward pace by 15 percent below your normal cadence to prevent premature glycogen depletion and early lactic acid accumulation in the quadriceps.
- Shorten the pole stride: As incline increases, shorten the forward plant of the poles. Planting the tips too far forward on steep slopes forces the shoulder joints into excessive flexion, wasting upper-body power that should be driving vertical lift.
- Schedule functional pauses: For climbs exceeding 120 continuous vertical metres, schedule a static 90-second pause every 50 vertical metres to check pulse rate, verify map location, and clear perspiration. These micro-pauses must be explicitly factored into the master timetable.
- Buffer late-stage climbs: If the elevation profile shows a steep climb within the final quarter of the journey, apply an additional 20 percent time penalty to that segment to compensate for accumulated neuromuscular fatigue and reduced pole-strike force.
This systematic segmentation ensures that estimated arrival times remain grounded in physical reality rather than theoretical averages that ignore physical depletion.
Contingency Time Buffers for Weather Shifts
Weather exerts a direct drag on walking pace by altering surface friction and creating physical resistance. While a seasoned Nordic walker can easily maintain a pace of 5.5 kilometres per hour on a dry, compacted earth trail, that same path becomes radically slower when subjected to sustained rain or driving winds. A defensible route plan incorporates calculated time buffers based on atmospheric conditions.
Wind direction and strength dramatically influence pole work. Nordic walking relies on an extended backward arm push. In a headwind blowing at 40 kilometres per hour (roughly force 6 on the Beaufort scale), aerodynamic drag acts on both the body and the swinging limbs, adding between 8 percent and 14 percent to travel times. Conversely, strong crosswinds destabilize pole placement, repeatedly knocking lightweight carbon shafts off line and forcing the walker to widen their stance, which shortens horizontal stride length.
Precipitation degrades the interface between footwear, pole tips, and terrain. Wet chalk, exposed tree roots, and heavy clay reduce traction. On clay-rich soils, mud adheres to walking boots and pole rubber paws, increasing swing weight and demanding extra mechanical effort with every step.
| Environmental Condition | Physical Effect on Nordic Walker | Time Addition per 5 km Segment |
|---|---|---|
| Dry, firm ground, light breeze | Optimal traction and pole grip | 0 minutes (baseline) |
| Headwind (35 to 50 km/h) | Aerodynamic resistance; shortened stride | Add 4 to 6 minutes |
| Persistent rain on heavy clay/mud | Loss of grip; mud adhesion; cautious pacing | Add 8 to 12 minutes |
| Wet, rocky or root-strewn track | Loss of pole tip purchase; slip risk | Add 6 to 10 minutes |
| Dense fog or navigation by compass | Frequent stops to confirm bearings and features | Add 10 to 15 minutes |
Before departing, check local meteorological forecasts for temperature, wind speed, gust velocity, and precipitation timing. Add the appropriate condition buffer to each exposed or vulnerable segment of the route plan. If the combined additions exceed 45 minutes across a day hike, adjust the route distance downward or advance the departure time to avoid finishing in failing daylight.
Common Mistakes
Even experienced navigators make predictable mathematical and visual errors when working with topographic contours. Being aware of these common traps prevents schedule failures in the field.
- Assuming consistent contour intervals across map series: Switching between 1:25,000 maps and 1:50,000 maps without verifying the vertical interval is an easy way to miscalculate elevation. Assuming a 10-metre line spacing is 5 metres results in underestimating total climbing effort by half.
- Ignoring the descent penalty: Assuming downhill travel is free time often leads to missed deadlines. Steep, technical descents require calculated footwork and pole braking, making them just as time-consuming as moderate climbs.
- Measuring straight lines instead of true track distance: Winding trails wrap around spurs and zig-zag through gullies. Measuring point-to-point distances with a rigid straight edge ignores switchbacks, undercounting horizontal distance by 15 percent to 30 percent on convoluted ground.
- Neglecting weight adjustments: A formula calibrated for a light daypack fails when carrying a 12-kilogram multi-day rucksack. Heavy loads lower walking speeds on flat terrain and increase the vertical ascent penalty by at least 20 percent.
Calibrating Your Personal Movement Rates
Formulaic estimates provide an essential starting structure, but real-world accuracy demands personal calibration. To establish your true travel baseline, select a local route segment measuring exactly 3 kilometres that includes both flat ground and at least 60 metres of sustained elevation change. Walk this segment using your standard Nordic equipment, carrying your typical pack weight, and record your split times across the flat, climbing, and descending portions under calm conditions.
Calculate your actual flat pace in minutes per kilometre and determine your personal ascent penalty by dividing the extra time spent on the climb by the vertical metres gained. Record these personal metrics in your route planning notes. When planning future walks, replace generalized table values with your measured figures, cross-referencing your calculations against updated weather reports and route terrain data. If you have pre-existing cardiovascular or musculoskeletal limitations, consult a physical therapist or sports medicine specialist to determine safe heart-rate thresholds before testing steep ascents under timed conditions.